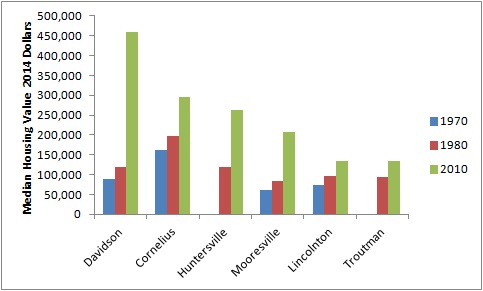
| Town | 1970 | 1980 | 2010 |
| Davidson | 87,740 | 119,954 | 459,000 |
| Cornelius | 162,773.40 | 196,600.00 | 294,586 |
| Huntersville | No data | 118,530 | 261,639 |
| Mooresville | 60,510 | 83,484 | 208,450 |
| Lincolnton | 74,414.58 | 96,783.34 | 134,332 |
| Troutman | No data | 94,532 | 134,549 |
*values are converted to 2014 dollars.
Data Source
U.S. Census of Housing 1970,1980, 2010: Davidson, Cornelius, Huntersville, Mooresville, Lincolnton and Troutman. Log Into North Carolina. http://data.osbm.state.nc.us/pls/linc/dyn_linc_main.show
Inflation adjustment tool
U.S. Inflation Calculator. 2014. http://www.usinflationcalculator.com/
Speak Your Mind