Hope Anderson is a senior biology major and mathematics minor from Carrboro, North Carolina. She currently serves as the co-Editor-in-Chief of the Davidsonian. She is also a member of Turner Eating House and on the Executive Board of Pre-PhDs of Davidson Science and Women in Math.
Davidson community members walking across campus would be remiss not to notice the little silver tags adorning many of the trees along their path. These tags date back to 1982 when the college first received its designation as an arboretum (Dick, “The Davidson College Arboretum”). As of 2005, the arboretum contained over 3000 individually labeled trees and shrubs (Davidson, “Arboretum”).

Nearly forty years after its establishment, the arboretum’s records remain almost entirely on paper. The most current map, created by Physical Plant in the early 90s, is a huge printed poster divided into grids and subgrids. Since then, available technology has improved dramatically. My fall 2021 independent research with Dr. Susana Wadgymar and collaborator Chloe Fisher (‘23) aims to digitize and update the arboretum’s records for both community and scientific use. To visualize data in a spatial format, we created a map of campus using Geographic Information System (GIS), which permits the storage, visualization, and analysis of data as a map ( “What Is a Geographic Information System (GIS)? U.S. Geological Survey”). In specific, ArcGIS is a popular and powerful GIS software used to create interactive and customizable maps online. Our goal was to use ArcGIS to establish a database and store arboretum data for years to come.
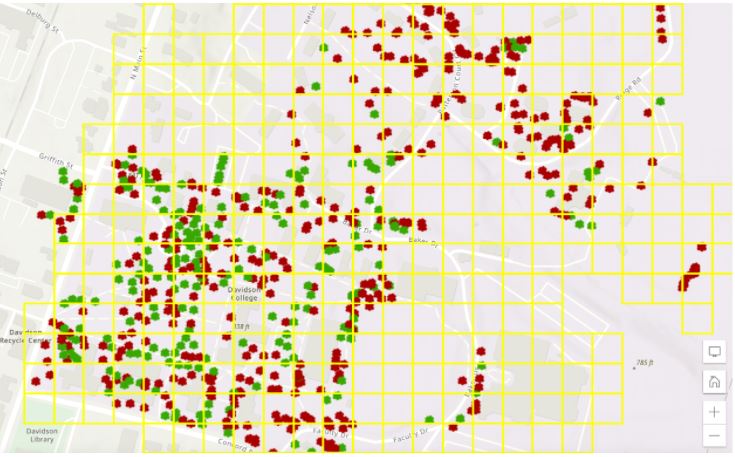
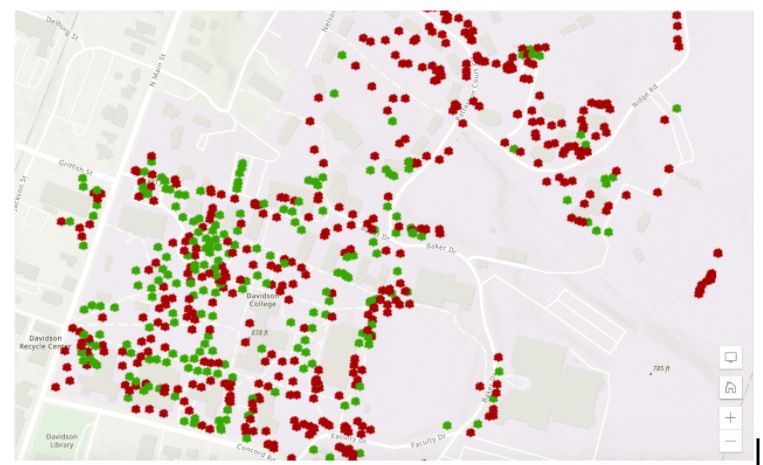
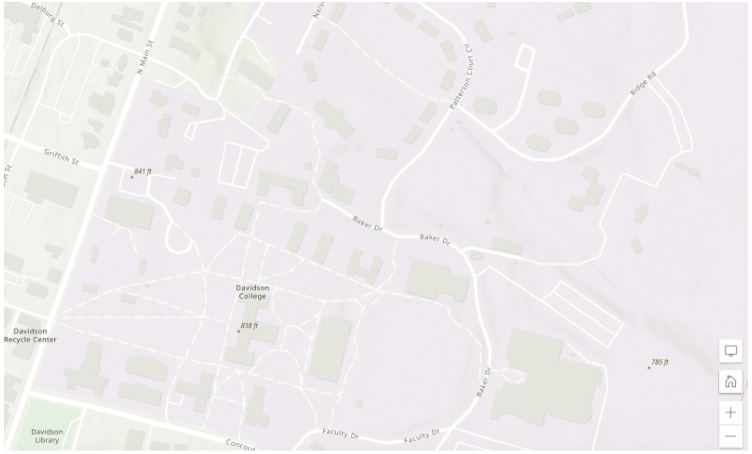
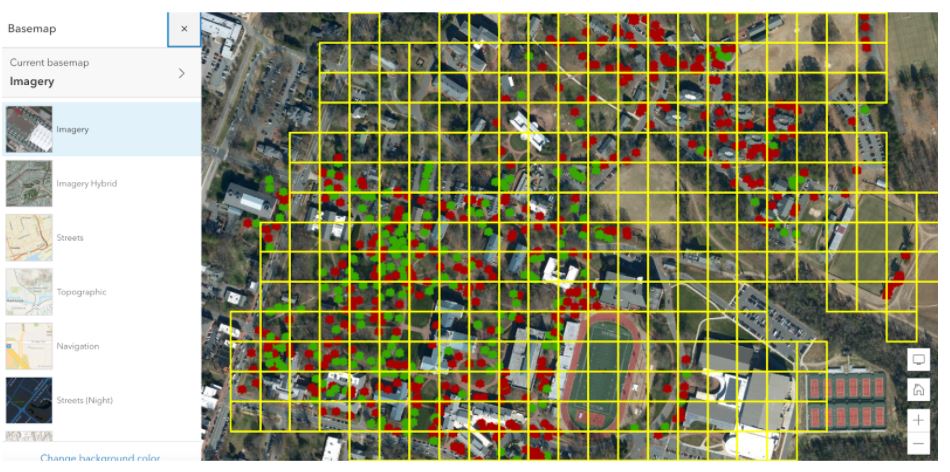
The Davidson arboretum is significant for several reasons. First, trees play a large role in carbon sequestration, or keeping carbon dioxide out of the atmosphere. The arboretum also cools campus and creates shady areas. Finally, the diverse collection of trees represented help us study and preserve native and engaged species in our region. We created an ArcGIS map with the help of visiting assistant professor of anthropology Dr. Maxime Lamoureux-St-Hilaire. ArcGIS maps are primarily composed of a basemap and one or more layers of information. Our arboretum map includes two layers—a feature layer storing data points, each corresponding to a tree, and a grid to help us divide campus into useful 50 x 50 meter squares. See figures 1-4 for additional information on how ArcGIS layers and the basemap work together.
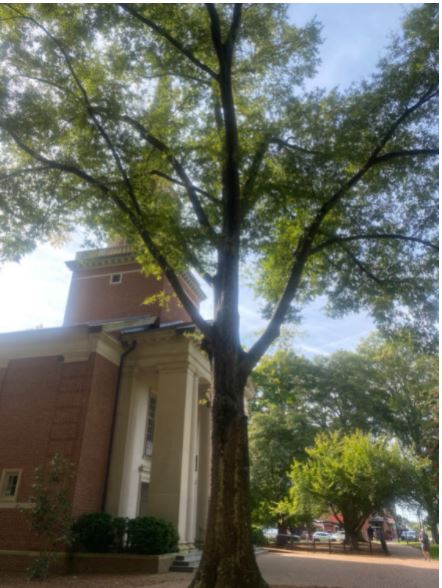
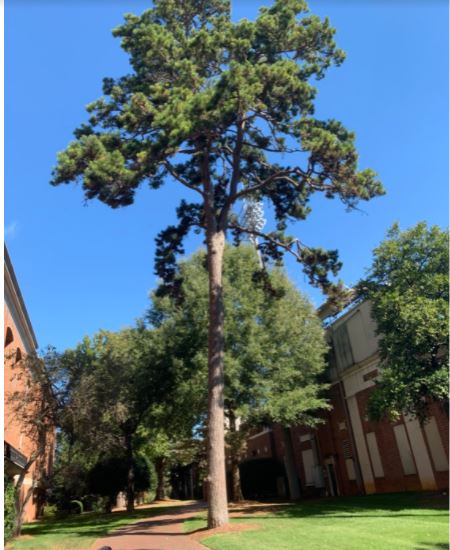
Students in Dr. Lamoureux-St-Hilaire’s fall 2021 Imaging the Earth class collected the majority of the data thus far using the ArcGIS Field Maps app. Each student spent a week in October recording data, collecting information on a tree’s location, whether or not it is tagged, whether the tree is coniferous or deciduous (see figs. 5 and 6), and the tree’s diameter at breast height (DBH, see fig. 7 at the top of the post). DBH is a simple but powerful dendrological measurement often used as a proxy for biomass and can be analyzed alongside height to approximate a tree’s carbon sequestration. Find a video demonstrating how to collect all these measurements at the end of this post.
After the initial census, Chloe and I started auditing individual grid squares (see fig. 1) to fill in any missing trees. This project is far from over; next semester Chloe and I will continue to audit the current data and identify trees without tags. We also plan to revisit previously collected points to update data the anthropology students didn’t collect, such as height and species. We’re hoping to involve additional members of the Davidson community with an interest in the arboretum. In future years, students can use the same map to collect new measurements for each tree, in order to continually update the online version of the map and compare data across years.
Thank you to Dr. Lamoureux-St-Hilaire, Dr. Susana Wadgymar, and Chloe Fisher for all their help this semester. I look forward to continuing this project in the spring and setting up future lab members for even more exciting research.
Video – “Collecting basic measurements using the ArcGIS Field Maps app”
References
Cottle, Jessica. “National Park and Recreation Month: Davidson College Arboretum.” Around the D: The Davidson College Archives & Special Collections blog (post), July 13, 2018. Accessed December 9, 2021. https://davidsonarchivesandspecialcollections.org/aroundthed/national-park-and-recreation-month-davidson-college-arboretum/.
Davidson, North Carolina 28035894-2000. “Arboretum.” Davidson. Accessed December 9, 2021. https://www.davidson.edu/offices-and-services/physical-plant/arboretum.
Dick, Lacy. “The Davidson College Arboretum: A Time Line | News of Davidson.” Accessed December 9, 2021. https://newsofdavidson.org/2018/07/29/7205/the-davidson-college-arboretum-a-time-line/.
“What Is a Geographic Information System (GIS)? | U.S. Geological Survey.” Accessed December 9, 2021. https://www.usgs.gov/faqs/what-geographic-information-system-gis.