1988-1990
Population Growth Trends
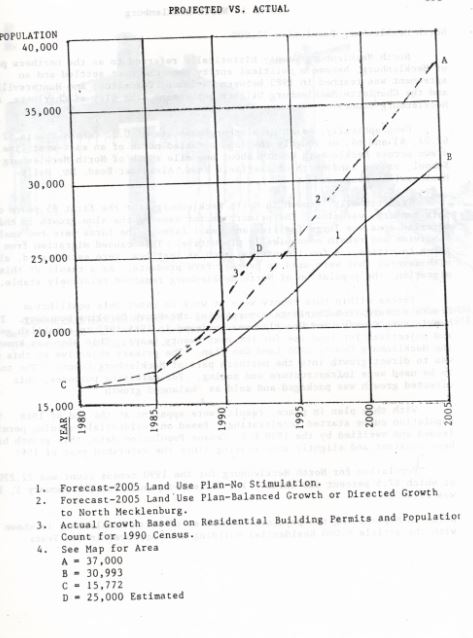
A graph demonstrating the projected population growth versus the actual growth based on residential building permits and population count for the 1990 Census data.
North Mecklenburg’s initial slow population growth was primarily due to the large families, and small farms that characterized its landscape. The farms were generally too small to be economically viable which drove plenty of families away from the farms and into the cities. The trajectory changed completely after the introduction of the lake, and for various reasons.
Though new housing developments near or on the lake were an impetus, I-77 North Mecklenburg also conveniently placed downtown Charlotte thirty minutes away from the Mecklenburg area.
Results were apparent within 3 years, by 1988. North Mecklenburg experienced one of the fastest growth rates in North Carolina with a growing rate of 17% from 1988 to 1989. From 1980 to 1990, approximately 4,454 units of residential permits were issued in North Mecklenburg and another 3,603 in Northeast Mecklenburg. Around 78% of this housing unit growth occurred only within a 5-year period.
Though people were generally happy
with the growth and
development of the area, commonly used spaces and institutions such as roads, schools, police protection, garbage disposal faced pl
enty of readjustments du
e to population growth. Traffic congestion worsened and sewer lines have had to extend to more areas. Growth is also making it difficult for Cornelius, Davidson, and Huntersville to maintain the small town identities.
Speak Your Mind